In my previous blogs ( Synchronization Monitoring: The fuel gauge for mobile networksand Synchronization is not a single number), I discuss the importance of making time error (TE) measurements on the transmitted mobile signal and visualizing this information as a TE vs time plot. This gives valuable insight into the performance of the network and the likelihood that it will or will not exceed the ±1.5µs limit required by the 3GPP standard. The question now arises as to whether further metrics should be used on Over the Air (OTA) measurements and what these might look like for 5G.
5G deployment is in its early days and network operators’ experience with deployed 5G networks is increasing all the time. The industry is still discovering the challenges of synchronization in a network with many overlapping 4G and 5G cell sites. So, yes, given the ease by which metrics like MTIE can be calculated from TE data, it could only be helpful if we looked at actual network synchronization performance in different ways. MTIE is a good place to start. It is a familiar metric and gives us insight into wander characteristics. The ITU-T recommendation G.8271.1 specifies the required dynamic low frequency time error (dTEL) performance at the edge of the packet network with an MTIE mask. However, what is a good MTIE measurement when measuring over the air? Is there a mask for the MTIE of a 5G transmission?
In short, no, but it is possible to derive an MTIE mask to guide in the interpretation of OTA results. Let’s start by looking back at 2G/3G mobile networks. Initially 2G/3G mobile networks were supported by a synchronous core such as TDM. The transmissions were Frequency Division Multiplexed (FDD) and interference was avoided by assuring frequency synchronization to 50ppb at the transmission.
The core network had to provide synchronization that was stable enough over the long term to allow the base station to be synchronized to 50ppb. In the short term, the core network did not have to achieve 50ppb. Base stations connected to TDM circuits contained very narrow-band low-pass filters to ensure the 50ppb criteria was met on their transmission. The MTIE mask at the end of a TDM circuit was given in G.823.
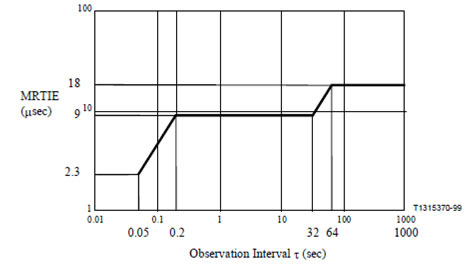
Fig.1 - G.823 - 2048 kbit/s interface output wander limit
Frequency stability at the mobile backhaul is traceable to a PRC in the core network, so the long-term frequency is very good (much less than 50ppb), but over the short term there can be significant variations. Most of the left-hand side of the G.823 mask allows frequency deviations far in excess of 50ppb (as much as 46 parts per million at the extreme left). Therefore, base stations needed ultra-stable filters to be able to guarantee that frequency error was filtered down to 50ppb for the RF carrier frequency. Such filters had double-oven OCXOs (very large, expensive, power-hungry devices) and needed careful thermal handling.
When G.8261.1 was developed, its purpose was to replace the TDM circuits connecting the base stations with Ethernet/IP networks. The assumption was that the base station design didn’t change, apart from the interface. In many cases, even that didn’t change, and the Ethernet/IP was terminated by an external cell-site gateway before being handed over to the base station on a TDM link.
The G.8261.1 mask shown below is almost identical to the G.823 mask above, with just an extension on the right-hand side to ensure the frequency accuracy remains better than 16ppb. The G.823 mask guarantees 18ppb in the long term, but not 16ppb. The base station filter is expected to do the rest by removing the short-term variations to ensure compliance with 50ppb.
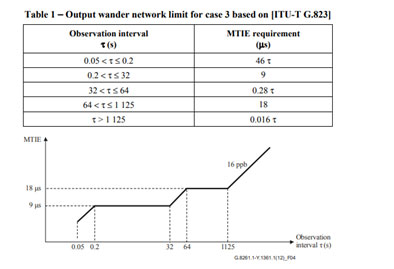
Fig.2 - Output wander network limit for case 3 based on [G.823]
For FDD systems, the MTIE mask at the RF output should contain a 50ppb limit on the short term, and a G.8261.1 limit on the long term.
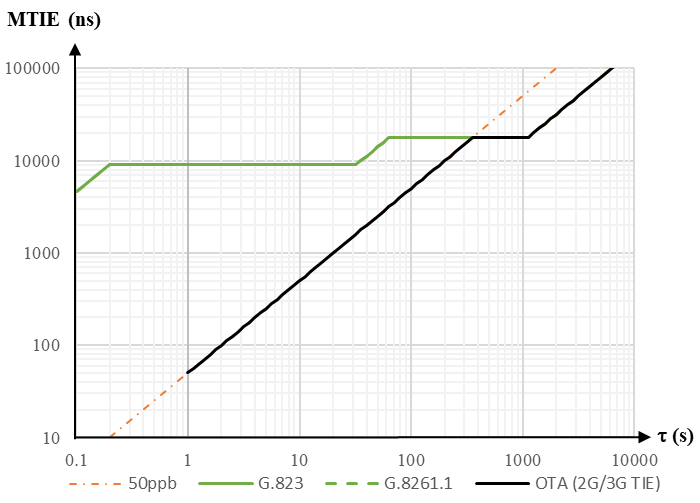
Fig.3
For illustration, the green line is G.823/G.8261.1, and the orange line is the 50ppb limit. The black line represents a notional MTIE curve for 2G, 3G and 4G FDD systems. As the fronthaul was not expected to add additional long-term noise to the output, the G.8261.1 MTIE mask dominates beyond about 400s. However, as the requirement is only that the transmission be synchronized in frequency to 50ppb, one could argue that the 50ppb (red dotted line) limit alone fully defines the MTIE curve.
In 4G and 5G TDD systems, the 50ppb frequency synchronization still applies but there is also the requirement to synchronize phase. The 3GPP standard specifies that overlapping cells be synchronized to within 3µs of each other. However, this is widely implemented as each cell being synchronized to within ±1.5µs of UTC. If we combine these all on one MTIE graph, the curves that dominate are 50ppb and 1.5µs. This is shown in red below.
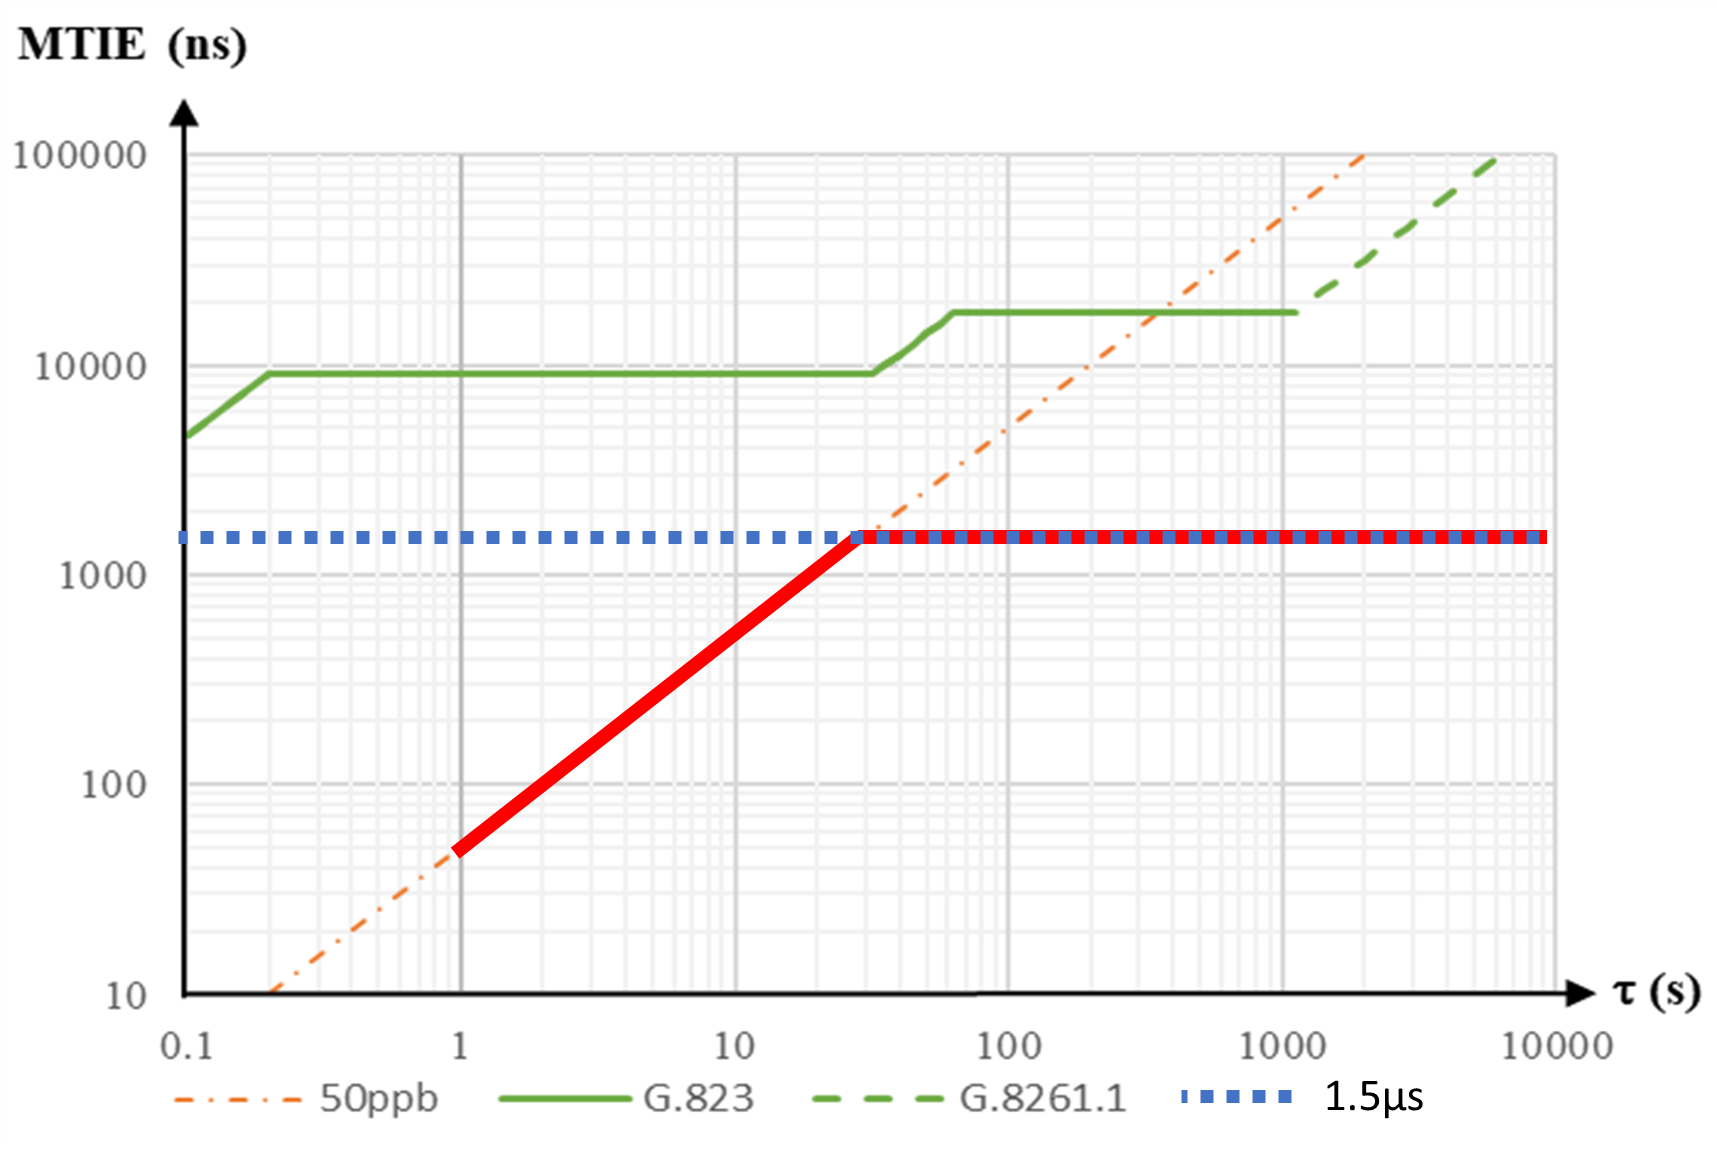
Fig.4
While it is the norm to look at the time error (TE) vs time plot of the OTA signal, looking at the MTIE of this same information may give some additional insight into the network. As a minimum, it will give an indication as to whether short term noise in the timing results in frequency offsets exceeding the 50ppb limit.
Bryan Hovey
Product Manager
Related product: Sentinel
Related blogs: Synchronization Monitoring: The fuel gauge for mobile networks and Synchronization is not a single number
Related literature: Timing and Synchronization Library

と次世代無線アクセスネットワーク(NG-RAN)の融合")
とは?")


 Summit 2022")


